Grocery Budget 2026: Best Numbers by Household Size
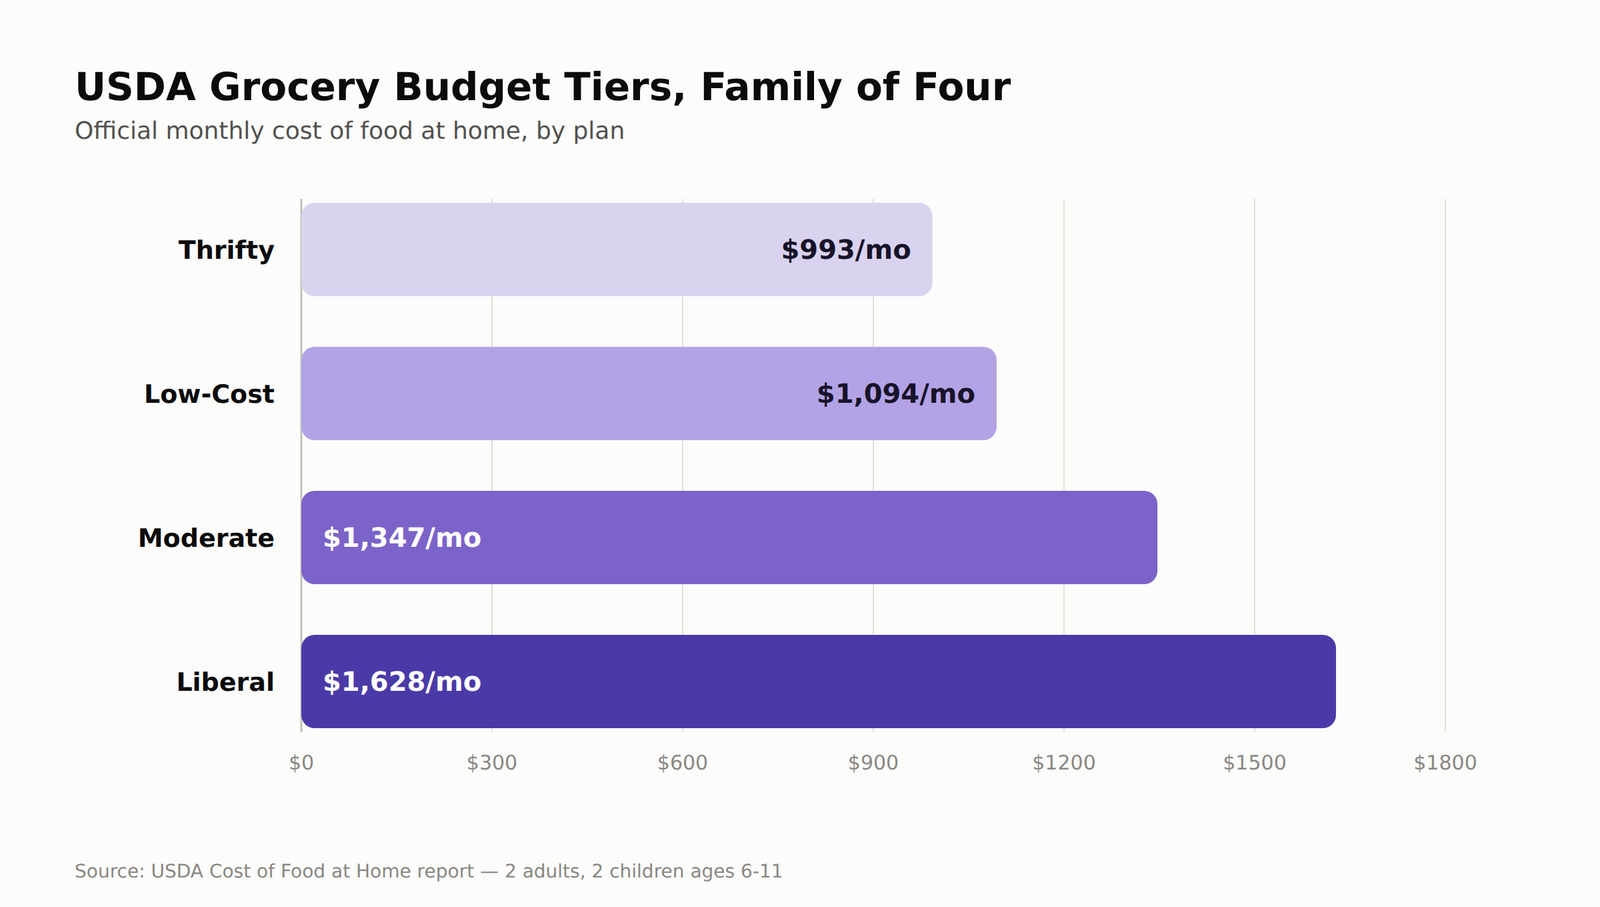
Bar chart of USDA monthly grocery budget tiers for a family of four: Thrifty $993, Low-Cost $1,094, Moderate $1,347, Liberal $1,628

“How much should I actually be spending on groceries?” has a real answer, not just a guess — the USDA publishes an official grocery budget every month, built from real retail prices, broken out by exactly how many people are in your house. Most people have never looked at it, which is why a grocery … Read more
Open Enrollment 2026: Best Way to Budget for Rising Health Insurance Costs

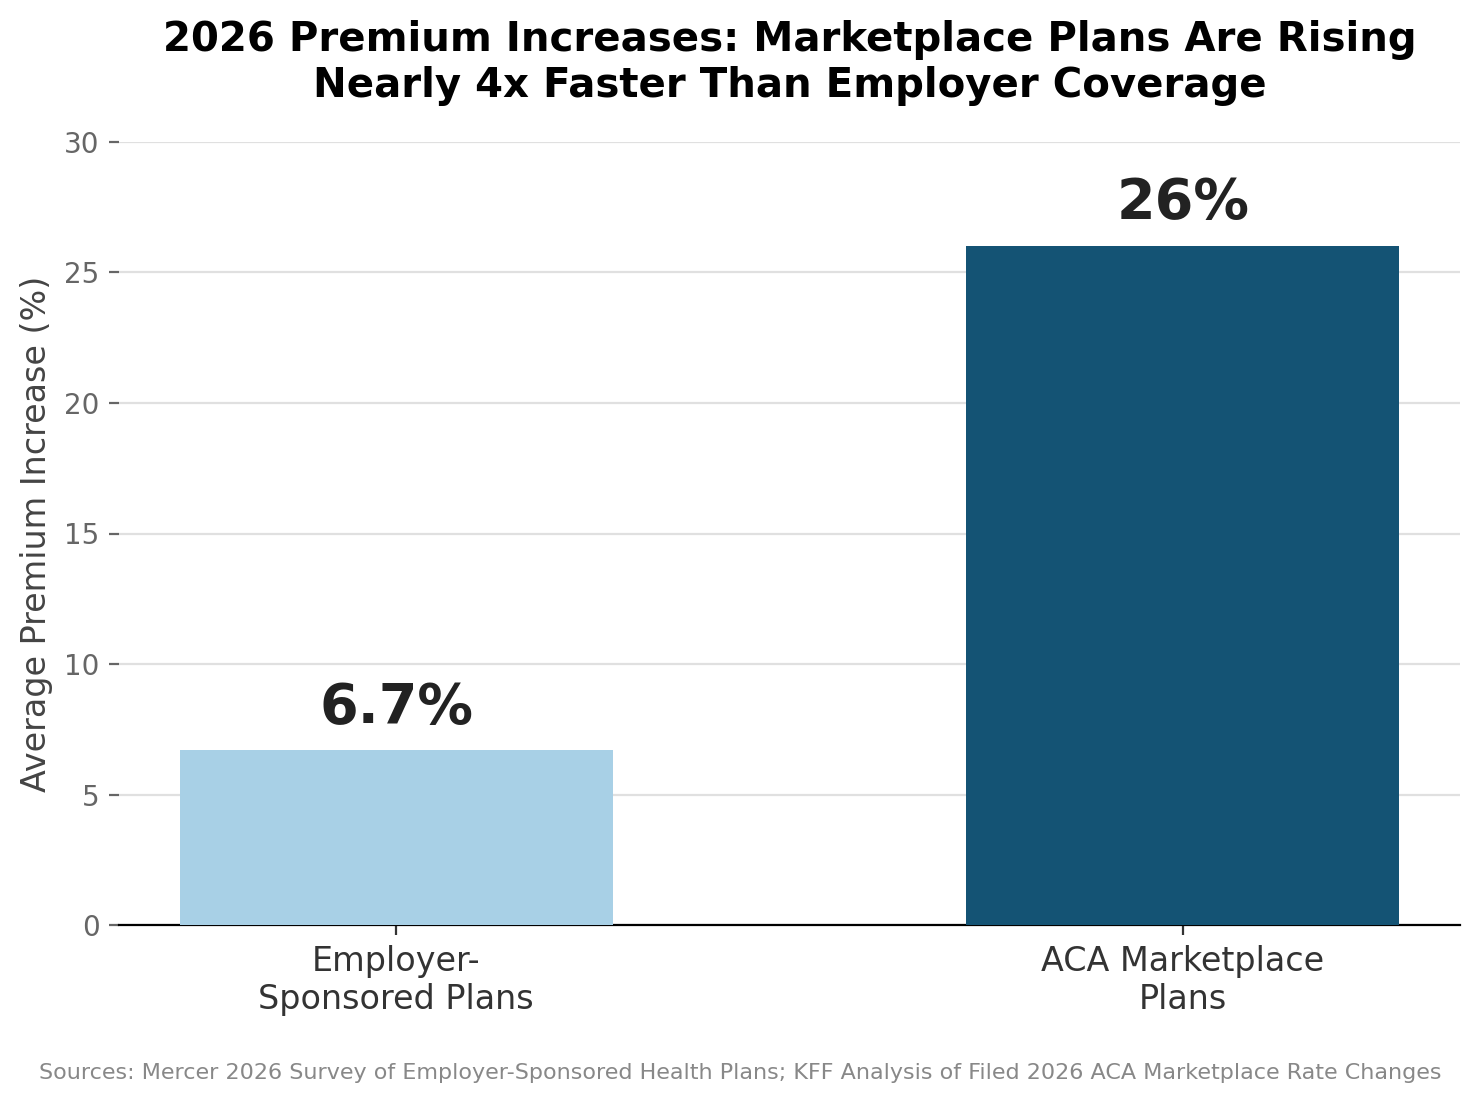
Bar chart comparing 2026 premium increases: 6.7% for employer-sponsored plans versus 26% for ACA marketplace plans

If your open enrollment window just opened and the new premium quote made you do a double take, you didn’t misread it. Open enrollment 2026 is landing with the sharpest premium increases in years, and the smart move isn’t waiting until your new paycheck deduction hits to figure out the math — it’s building the … Read more

What Is Lifestyle Creep? Best 2026 Guide

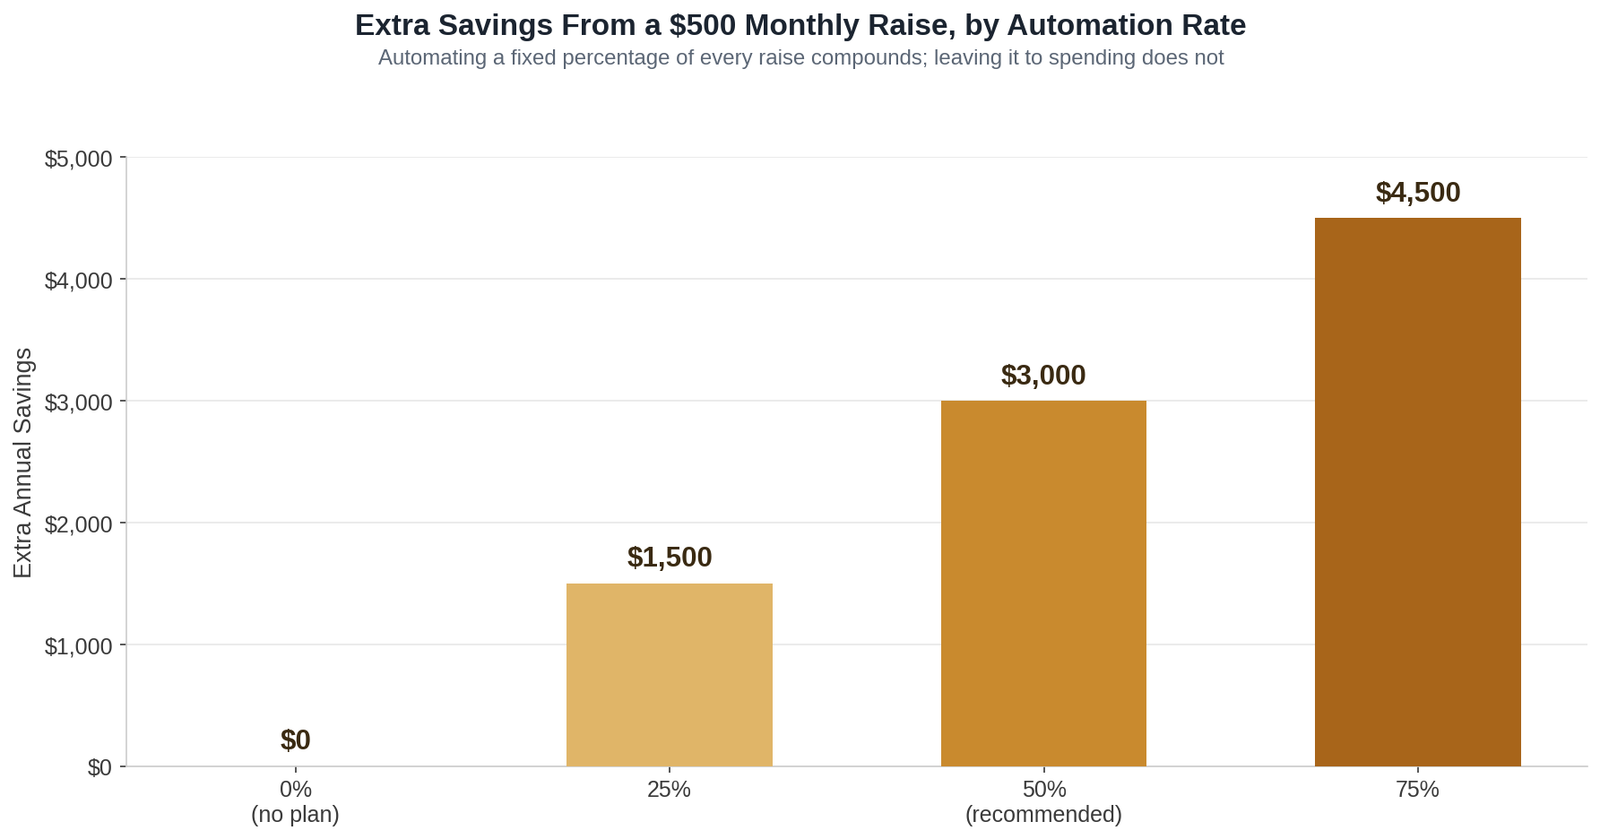
Bar chart showing extra annual savings from a $500 monthly raise at different automation rates for lifestyle creep

If your paycheck has gone up twice in the last two years and your savings balance still looks the same as it did before either raise, lifestyle creep is almost certainly the reason — not one big purchase you can point to, just a steady drift where a slightly better apartment, a few more takeout … Read more

Holiday Budget 2026: Best Way to Save Without Debt

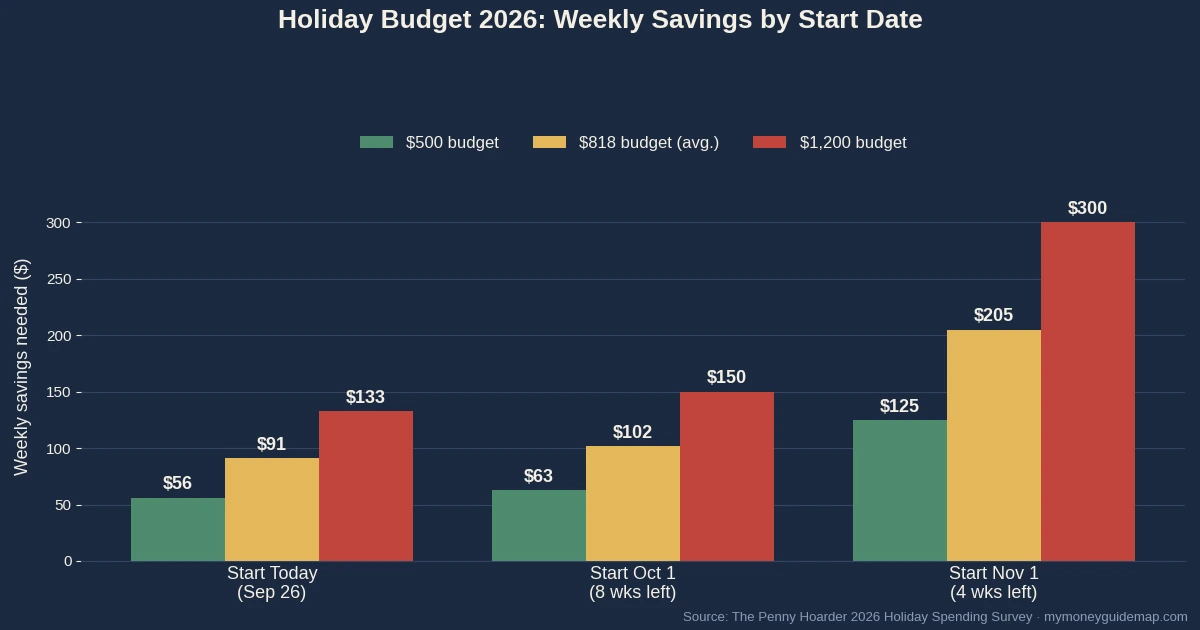
If you’ve ever hit January staring at a credit card bill you don’t remember creating, a holiday budget 2026 plan is probably the thing that was missing last year. Most people don’t overspend on one big purchase — they overspend in a dozen small ones spread across two months, and none of it gets tracked … Read more

Cash Stuffing: Best 2026 Numbers

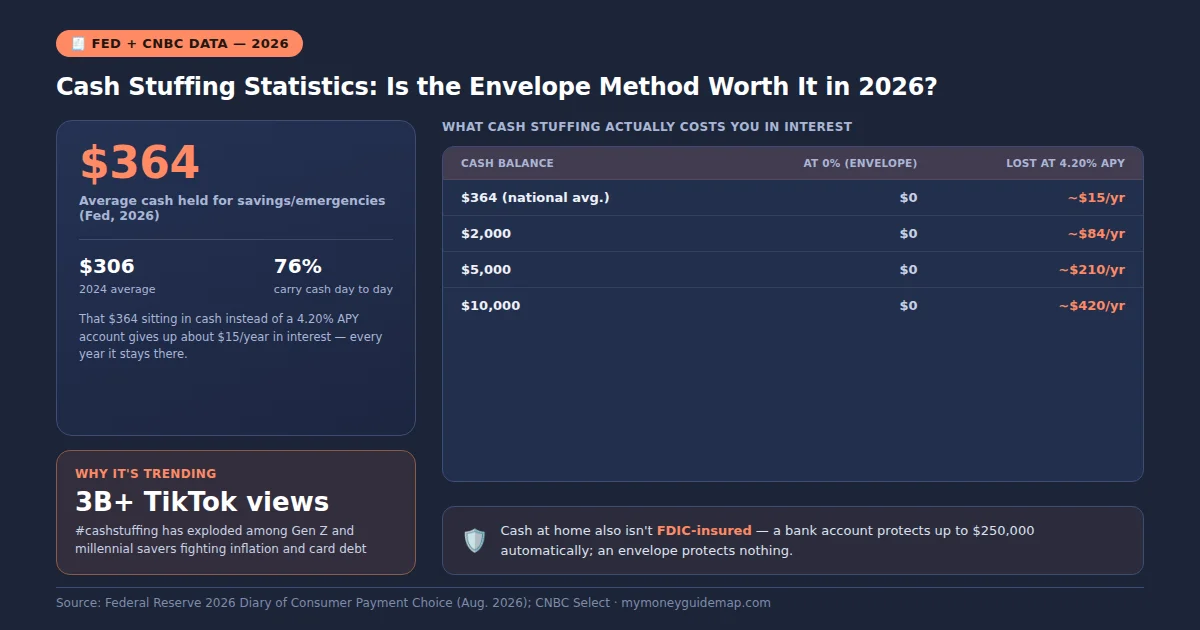
Cash stuffing chart showing lost interest and Fed data on envelope budgeting savings

Cash stuffing has racked up more than 3 billion combined TikTok views under hashtags like #cashstuffing, and new Federal Reserve data shows the trend is more than a passing fad: the average American now sets aside $364 in cash specifically for savings and emergencies, up from $306 just two years earlier. That’s real, measurable growth … Read more

Back-to-School Spending: Best 2026 Budget Numbers

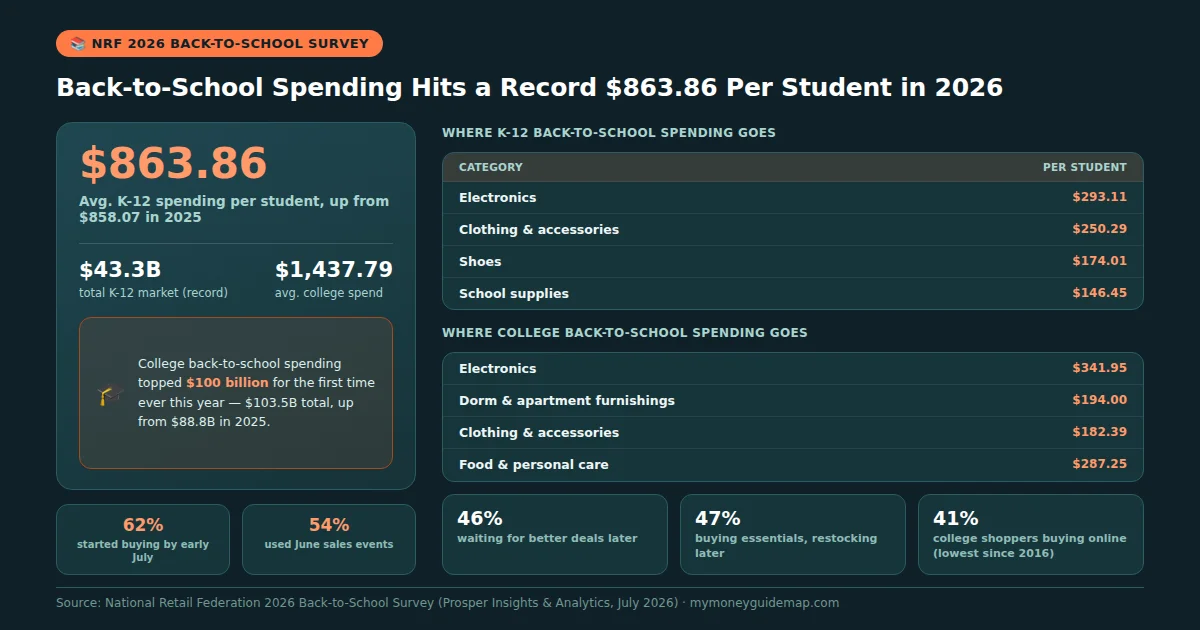
Chart showing back-to-school spending hit a record $863.86 per K-12 student and $1,437.79 per college student in 2026, with a category breakdown of where the money goes and back-to-school shopping timing statistics

Back-to-school spending just hit a record high, and the numbers explain why so many families feel the pinch every August. The average household with kids in kindergarten through 12th grade expects to spend $863.86 per student this year, up from $858.07 in 2025, pushing total K-12 spending to $43.3 billion nationwide — a record, according … Read more

How Many Americans Live Paycheck to Paycheck? Best 2026 Data

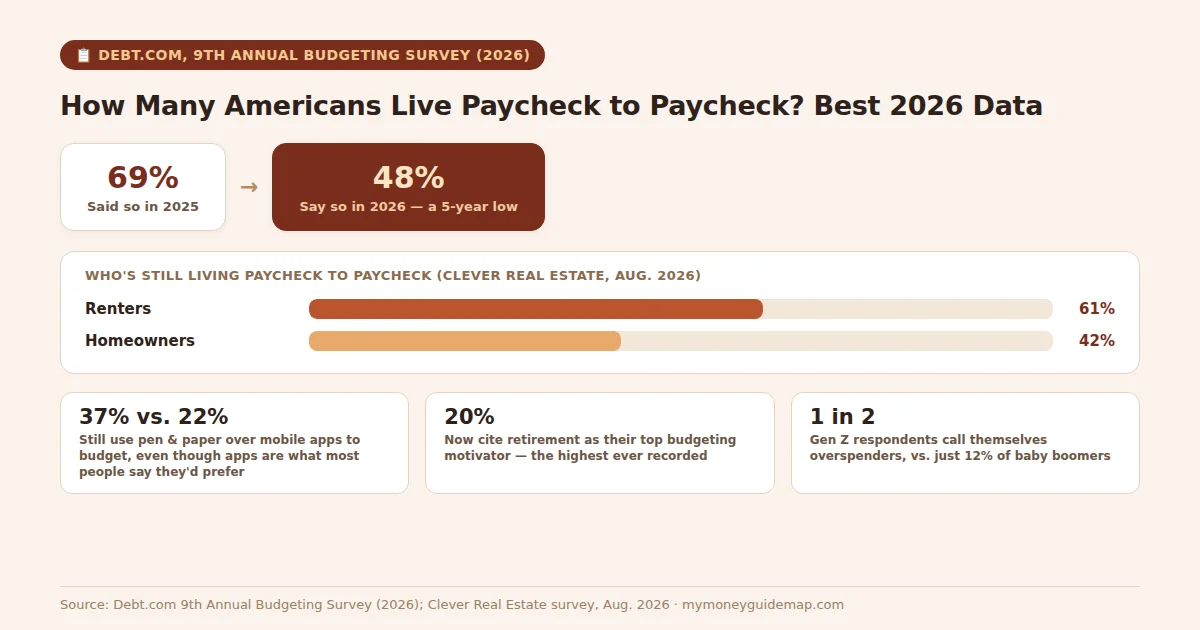
how many americans live paycheck to paycheck, chart showing the rate falling from 69% to 48% and the renter vs homeowner gap

How many Americans live paycheck to paycheck in 2026? Debt.com’s ninth annual budgeting survey, released this summer, found the number has dropped sharply: 48% of Americans now say they’re living paycheck to paycheck, down 21 percentage points from 69% just a year earlier — the lowest share the survey has recorded in five years of … Read more

Is No Tax on Overtime Worth It? Best 2026 Numbers

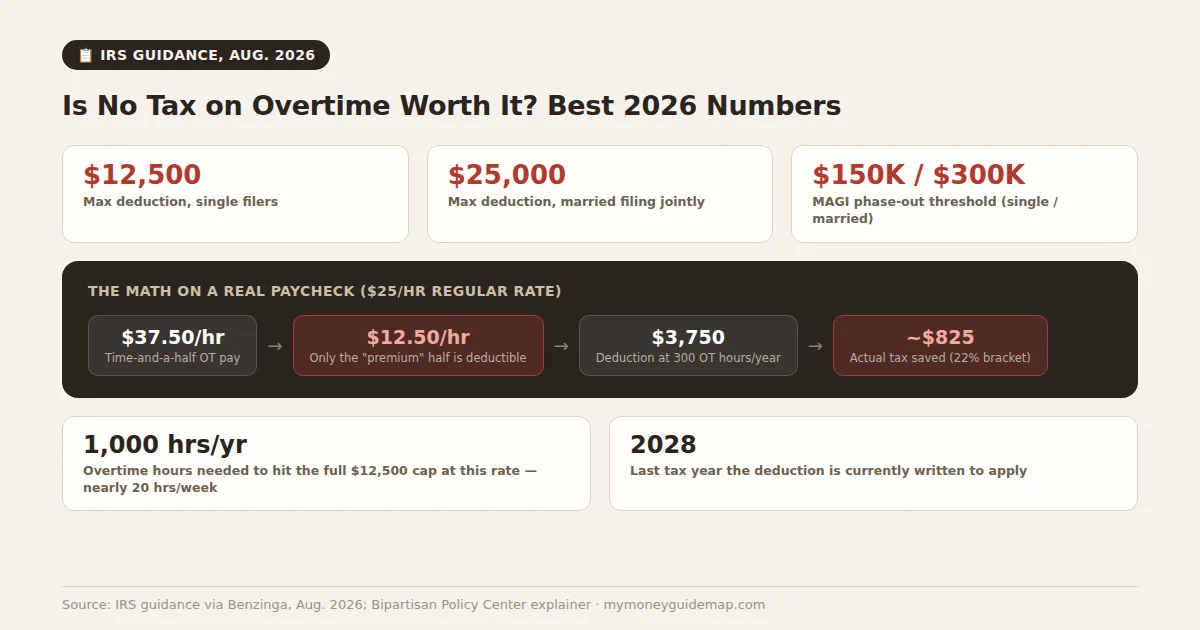
is no tax on overtime worth it

Is no tax on overtime worth it, or does the name oversell what the deduction actually does? The new federal tax break, in effect for the 2026 tax year, doesn’t make all of your overtime pay tax-free — it only covers the “premium” portion, the extra half in time-and-a-half, according to the IRS’s own updated … Read more

Does the 50/30/20 Rule Still Work? Best 2026 Numbers

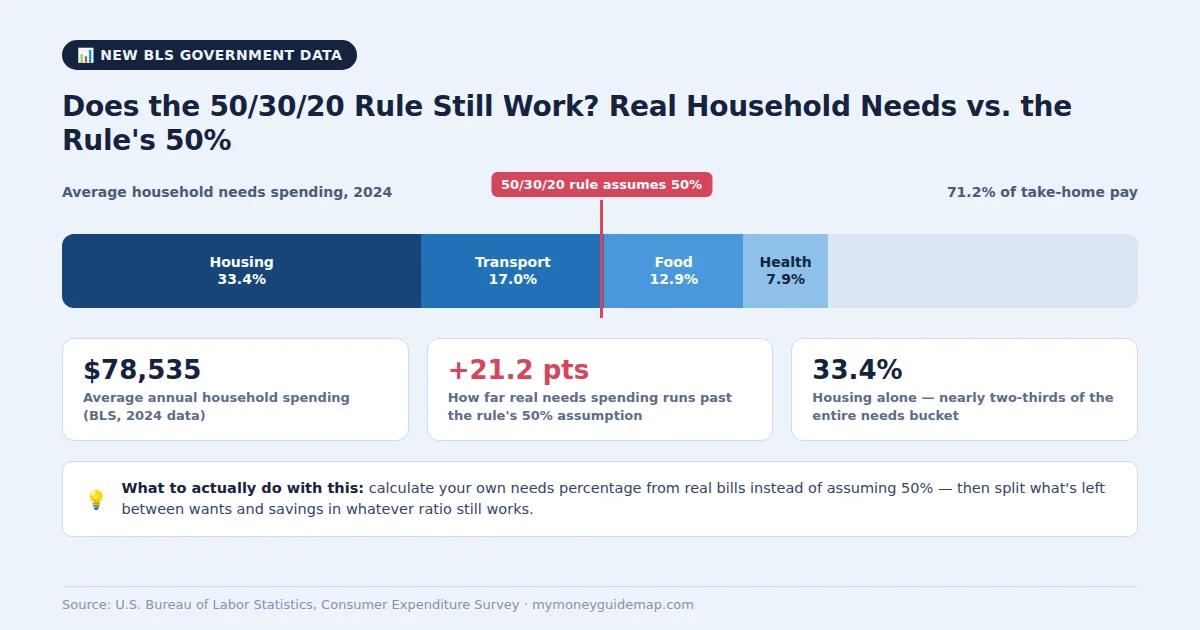
does the 50/30/20 rule still work

Does the 50/30/20 rule still work, or is it asking something most households can no longer do? The rule splits take-home pay into 50% needs, 30% wants, and 20% savings or debt payoff. New government spending data tells a different story about that first number: according to the Bureau of Labor Statistics’ latest Consumer Expenditure … Read more