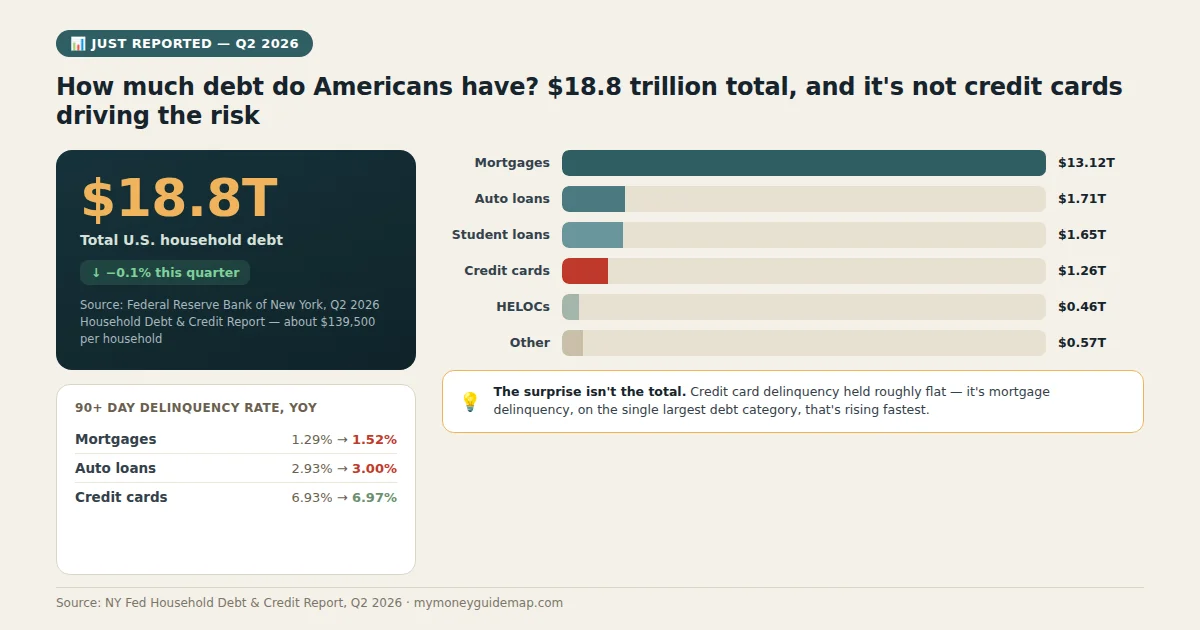
How much debt do Americans have right now? The New York Fed’s Q2 2026 Household Debt and Credit Report puts the number at $18.8 trillion total — a small 0.1% dip from the previous quarter, the first decrease in a while. Spread evenly across the roughly 134.8 million households in the U.S., that works out to about $139,500 per household on average, though that figure blends households carrying six-figure mortgages with households carrying no debt at all, so it’s a scale marker more than a typical number.
How Much Debt Do Americans Have, Broken Down by Type?
Mortgages make up the overwhelming majority of that total, and the rest splits out into a few familiar categories.
| Debt type | Total (Q2 2026) | Avg. per U.S. household |
| Mortgages | $13.117 trillion | ~$97,300 |
| Auto loans | $1.713 trillion | ~$12,700 |
| Student loans | $1.651 trillion | ~$12,200 |
| Credit cards | $1.263 trillion | ~$9,400 |
| HELOCs | $0.459 trillion | ~$3,400 |
| Other | $0.568 trillion | ~$4,200 |
Credit card debt gets the most headlines — we covered its own $1.26 trillion record separately — but it’s actually the third-largest category here, well behind mortgages and even behind auto loans.
The Real Story Isn’t the Total — It’s Which Debts Are Getting Riskier
This is where the Fed’s report gets more interesting than the headline total suggests. Alongside the balances, the Fed tracks a “transition into serious delinquency” rate for each debt type — essentially, what share of previously-current balances slipped into being 90+ days late during the quarter. And the pattern isn’t what you’d expect from the credit-card-focused news cycle: credit card transition-into-delinquency held roughly flat at 6.97%, up only slightly from 6.93% a year earlier. Auto loans ticked up more, from 2.93% to 3.00%. But mortgages saw the sharpest move of the three, rising from 1.29% to 1.52% — a smaller number in absolute terms, but a much bigger percentage jump, and on the single largest category of debt Americans carry.
Meanwhile, the overall transition-into-delinquency rate across all debt types actually improved, falling from 2.91% to 2.57%. So the full picture is a bit of a paradox: the aggregate risk measure is getting better, credit cards (the category everyone worries about) are holding roughly steady, and it’s mortgages — the debt type most people consider the “safe” one — that’s quietly moving in the wrong direction fastest.
How Much Debt Do Americans Have Compared to a Few Years Ago?
Zooming out helps put the current $18.8 trillion figure in context. Back in Q3 2022, total household debt sat at $16.51 trillion — meaning the total has grown by roughly $2.29 trillion, or about 13.9%, in under four years. Some of that growth is just home prices and vehicle prices rising along with everything else, and some of it reflects more households taking on mortgages and auto loans as the economy expanded. Either way, the direction has been consistently upward for most of the past decade, which makes this quarter’s small 0.1% dip worth noting precisely because it’s an exception rather than the trend.
What This Means for Your Own Debt Picture
So how much debt do Americans have that actually matters to you personally? The national total doesn’t change how much debt any individual owes, but it’s a useful corrective if you’ve been assuming credit cards are automatically the riskiest thing on your balance sheet. If you’re carrying a mortgage, the Fed’s data is a reminder that missed-payment risk is rising across the housing market generally, not just for people who are already struggling — worth factoring in if your own budget has gotten tighter lately, even if your credit card balance is under control. And if you’re comparing your own numbers to the averages above, remember that these are aggregate figures across all 134.8 million households, including the ones with $0 in a given category — a single household carrying a mortgage, an auto loan, and a credit card balance will typically owe more than the “average per household” figures for each category added together, not less.
The $18.8 trillion headline number matters less than the shape underneath it. How much debt Americans have in total barely moved this quarter — but which of those debts are quietly becoming harder to keep current on is the part worth actually watching.